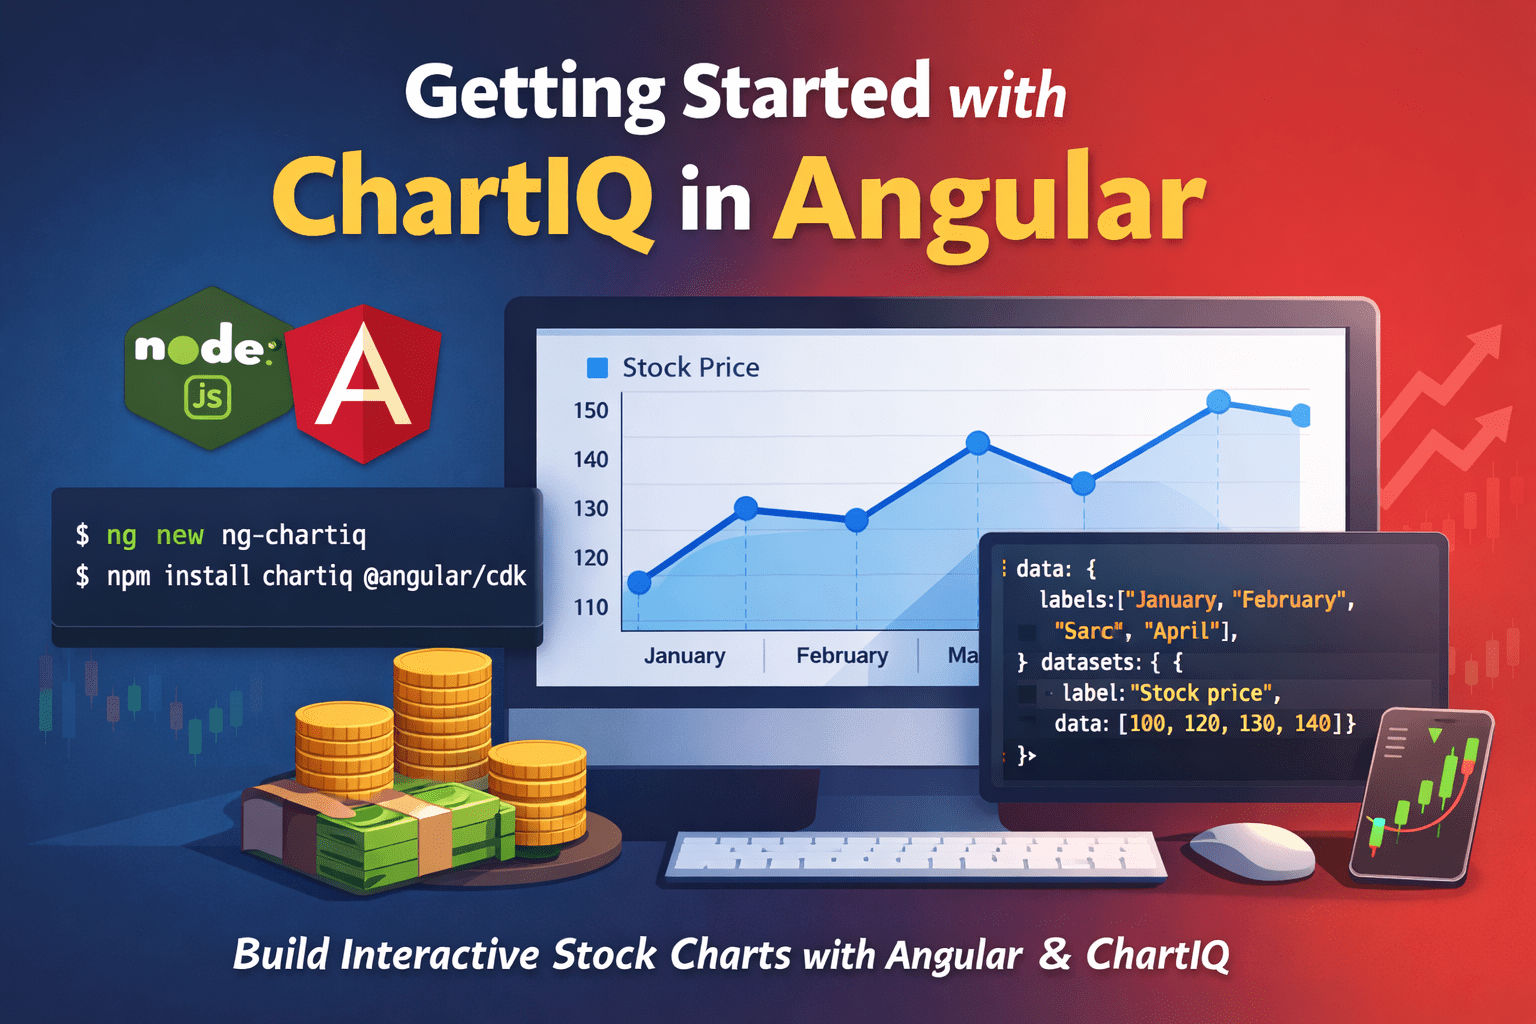
ChartIQ is a powerful and versatile charting library that allows you to create interactive financial charts for your web applications. In this tutorial, we will be using Angular to build a simple charting application that displays a line chart of stock price data. Before we begin, you will need to have the following tools installedContinue reading “Getting started with ChartIQ in Angular.”
Tag Archives: Charts
Getting started with Dygraphs in Angular.
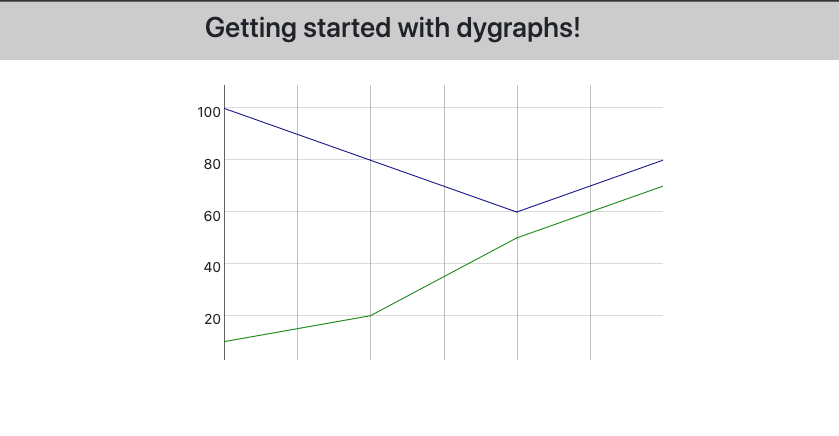
dygraphs is a very powerful charting lib, but how do you get starting using dygraphs in Angular application?, here is how!.
