Skip to content

Kumar Gandhi Koppolu

you should be working…

  • Home
  • About
  • Blog
  • Contact

Tag Archives: Bar chart

Developing charts using d3.js in Angular.

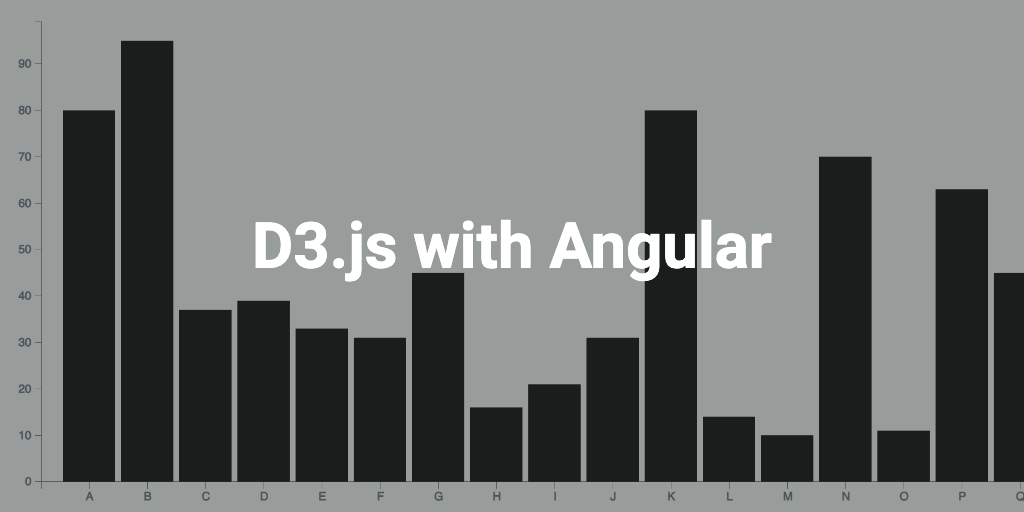
Using d3.js to develop a simple bar chart in Angular application.

Posted byKumar Gandhi KJune 16, 2022June 30, 2022Posted in@angular/cli, Angular, Bar chart, Charts, d3.js, d3.js, d3JSTags:Angular, Bar chart, d3.js, d3JS2 Comments on Developing charts using d3.js in Angular.
Kumar Gandhi Koppolu, Create a website or blog at WordPress.com
  • Subscribe Subscribed
    • Kumar Gandhi Koppolu
    • Already have a WordPress.com account? Log in now.
    • Kumar Gandhi Koppolu
    • Subscribe Subscribed
    • Sign up
    • Log in
    • Report this content
    • View site in Reader
    • Manage subscriptions
    • Collapse this bar