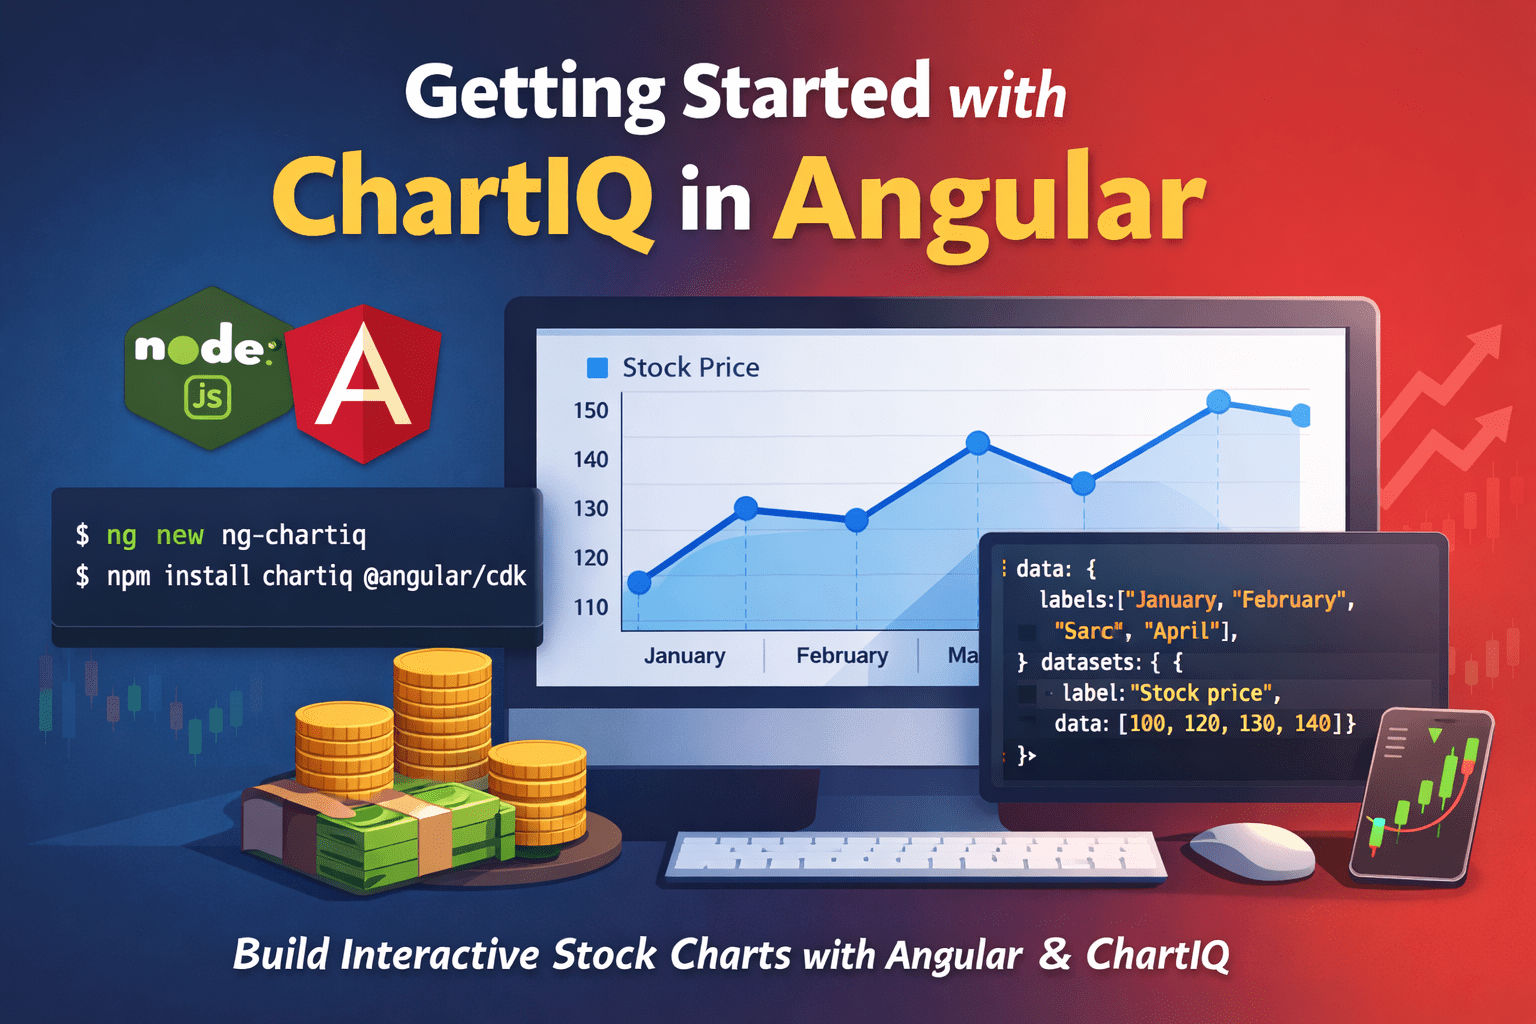
ChartIQ is a powerful and versatile charting library that allows you to create interactive financial charts for your web applications. In this tutorial, we will be using Angular to build a simple charting application that displays a line chart of stock price data. Before we begin, you will need to have the following tools installedContinue reading “Getting started with ChartIQ in Angular.”
Category Archives: Charts
Building interactive charts with AmCharts in Angular

AmCharts is one of the widely used JavaScript-based interactive charts and maps programming libraries and tools. In this post we will look at how to integrate the AmCharts into Angular project. Prerequisites Before getting started, make sure you have the following dependencies installed: Step 1: Create a new Angular project To create a new AngularContinue reading “Building interactive charts with AmCharts in Angular”
Getting started with Dygraphs in Angular.
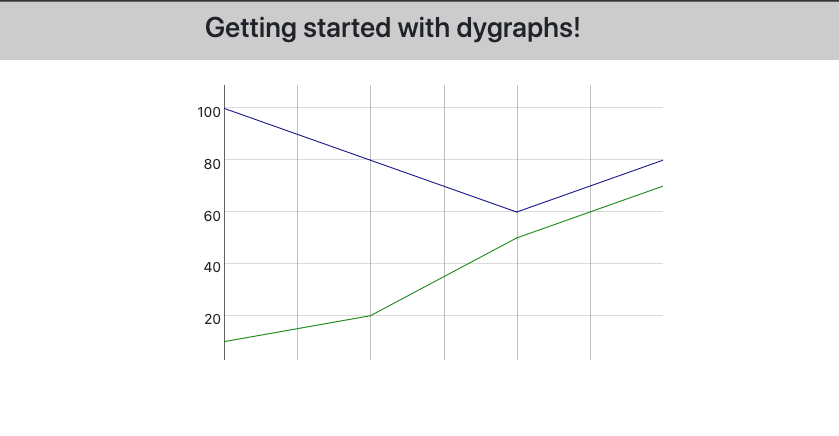
dygraphs is a very powerful charting lib, but how do you get starting using dygraphs in Angular application?, here is how!.
Create Heat map using d3.js with Angular.

Using d3.js to develop a simple heat map chart in Angular application.
Developing charts using d3.js in Angular.
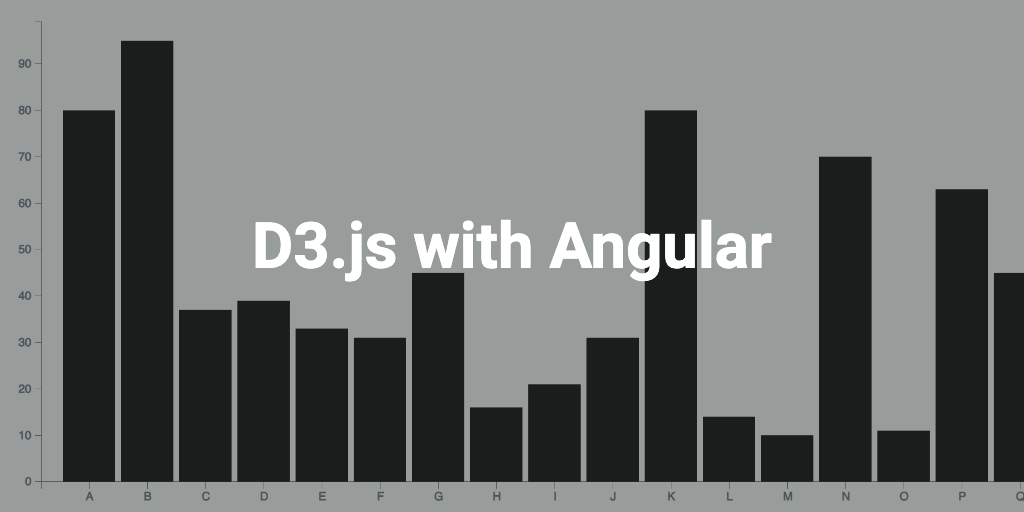
Using d3.js to develop a simple bar chart in Angular application.
