In this post we will try to learn how to export data (JavaScript array or data) to an excel file using the SheetJS / XLSX library.
Steps:
- Create the angular app.
- Add the dependencies, like, xlsx.
- Create the table in UI.
- Logic to export data in the table to excel file.
Create the angular app
We are going to use the angular guide to create a new angular project.
ng new ng-xlsx
Now we have our angular application ready, let’s try to add other dependencies to show table data on the app component and also add the xlsx library.
Add the dependencies
npm i bootstrap lodash xlsx --save
Here we are installing few packages, bootstrap (To display the data in a table), lodash (For performing data manipulation), xlsx (SheetJS library)
We also need @types for lodash, so let’s install that too.
npm i @types/lodash --save-dev
Create the data table
First, we need to import the bootstrap CSS framework into our Angular project so that we can see the styled components / table on the page. Open styles.scss file and add below code.
@import './node_modules/bootstrap/scss/bootstrap';

html,
body {
    font-size: 12px !important;
    margin: 0;
    overflow: hidden;
    width: 100vw !important;
    height: 100vh !important;
}

.page-container {
    padding: 20px;
}
Now open the app component template file (app.component.html) and paste below code, which displays our table.
<div class="page-container">
  <h3>
    {{ title }}
  </h3>
  <div class="row">
    <div class="col-md-12">
        <table class="table table-striped">
            <thead>
                <tr>
                    <th scope="col">#</th>
                    <th scope="col">First</th>
                    <th scope="col">Last</th>
                    <th scope="col">Handle</th>
                </tr>
            </thead>
            <tbody>
                <tr *ngFor="let item of users">
                    <th scope="row">{{ item.uid }}</th>
                    <td>{{ item.first }}</td>
                    <td>{{ item.last }}</td>
                    <td>{{ item.handle }}</td>
                </tr>
            </tbody>
        </table>
        <button type="button" class="btn btn-primary" (click)="exportRawDataToExcel(users, title)">Export to Excel</button>
    </div>
  </div>
</div>
And our data in the table is as below, we need to paste it inside the app component script file (app.component.ts).
// Add import statements
import * as XLSX from "xlsx";
import * as _ from "lodash";

// Add below code to the class
title = "ng-xlsx";

users = [
    {
      uid: "1",
      first: "Mark",
      last: "Otto",
      handle: "@mdo",
    },
    {
      uid: "2",
      first: "Jacob",
      last: "Thornton",
      handle: "@fat",
    },
    {
      uid: "3",
      first: "Larry the Bird",
      last: "Thornton",
      handle: "@twitter",
    },
  ];
Run the Angular application.
npm start
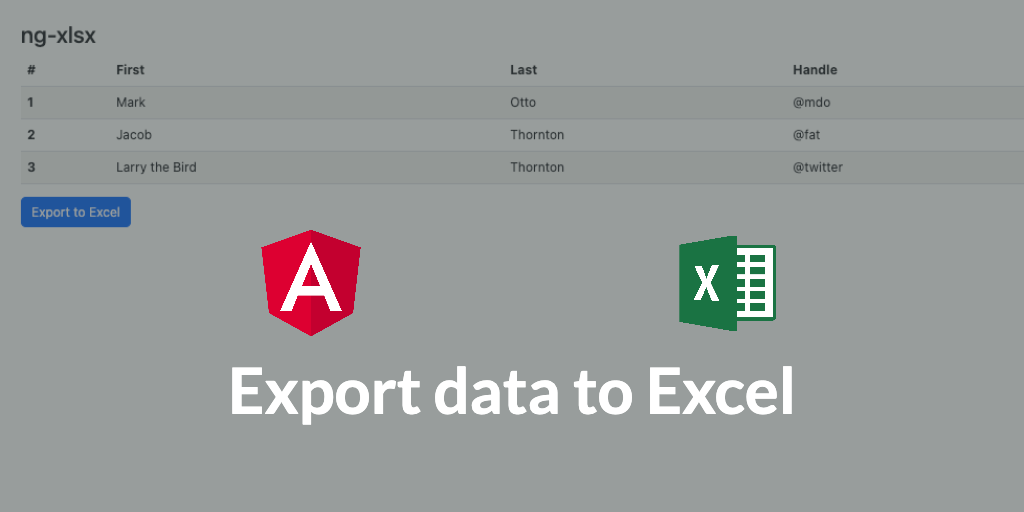
Open the app on the browser, http://localhost:4200/ and we should see our table as below.
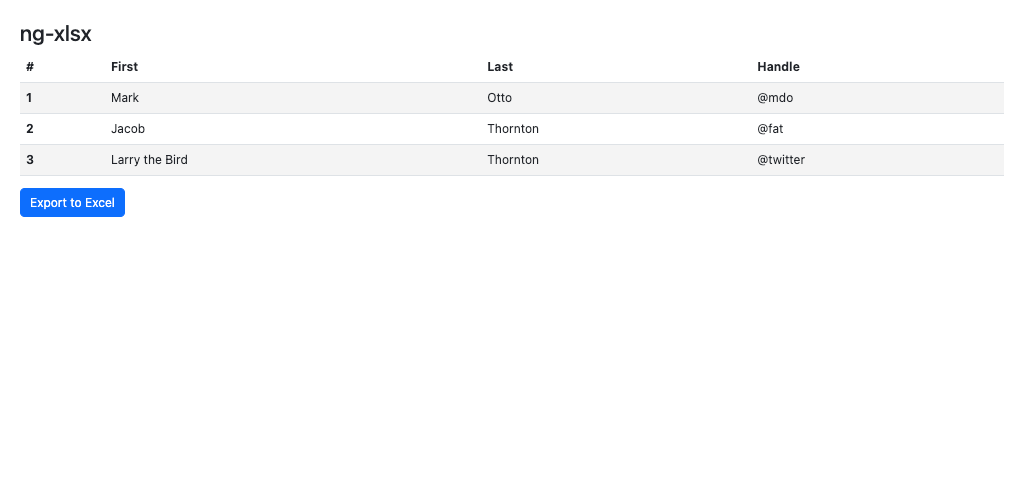
Export data to excel file
We have our data ready, now let’s write the logic to download this table data to the excel file.
exportRawDataToExcel(tableData: any, fileName: string) {
    if (!tableData || (tableData && tableData.length === 0)) {
      throw new Error("No data to export");
    }
    const wb = XLSX.utils.book_new();
    const data = [];
    const merges = [];
    const headers = [];
    const keys: string[] = _.keys(_.head(tableData));
    let mergeAcrossStartC = 0;
    for (let m = 0; m < keys.length; m++) {
      merges.push({
        s: { r: 0, c: mergeAcrossStartC },
        e: {
          r: 0,
          c: mergeAcrossStartC,
        },
      });
      mergeAcrossStartC = mergeAcrossStartC + 1;
      headers.push(keys[m]);
    }
    data.push(headers);
    for (let j = 0; j < tableData.length; j++) {
      const rowData = [];
      for (let k = 0; k < keys.length; k++) {
        rowData.push(tableData[j][keys[k]]);
      }
      data.push(rowData);
    }
    const ws = XLSX.utils.aoa_to_sheet(data);

    ws["!cols"] = [];
    _.forEach(headers, (val) => {
      ws["!cols"].push({ wpx: 120 });
    });
    ws["!merges"] = merges;
    /**
     * Add worksheet to workbook
     */
    XLSX.utils.book_append_sheet(wb, ws, "Sheet 1");
    XLSX.writeFile(wb, fileName + ".xlsx");
  }
Above code will be overwhelming, so I would suggest to investigate the SheetJS tool and learn few things. But to summarise…
- The function takes two parameters, first the raw data (JSON / array) and second the file name. The raw data is exported to the excel file and we name the excel file with the given file name in the function parameter.
- We parse the data to construct into a format that is needed for the xlsx library.
- Using few functions in the library, like,
- XLSX.utils.book_new() – Creates a new work book.
- XLSX.utils.aoa_to_sheet() – Create a new work sheet with the given data (JS array)
- XLSX.utils.book_append_sheet(wb, ws, “Sheet 1”) – Adds a work sheet to the work book.
- XLSX.writeFile(wb, fileName + “.xlsx”) – Finally create the excel file.
I guess this is it, when we click the export button below the table we should see a new .xlsx file downloaded with the data as seen in the table!!.
Checkout complete code on Github.