ChartIQ is a powerful and versatile charting library that allows you to create interactive financial charts for your web applications. In this tutorial, we will be using Angular to build a simple charting application that displays a line chart of stock price data.
Before we begin, you will need to have the following tools installed on your machine:
- Node.js: This is a JavaScript runtime that is required to run Angular applications. You can download it from the official website at https://nodejs.org/.
- Angular CLI: This is a command-line interface for Angular that makes it easy to create, build, and deploy Angular applications. You can install it by running the following command:
npm install -g @angular/cli
Once you have these tools installed, you are ready to start building your ChartIQ Angular application.
Step 1: Create a new Angular project
To create a new Angular project, open a terminal window and navigate to the directory where you want to store your project. Then, run the following command:
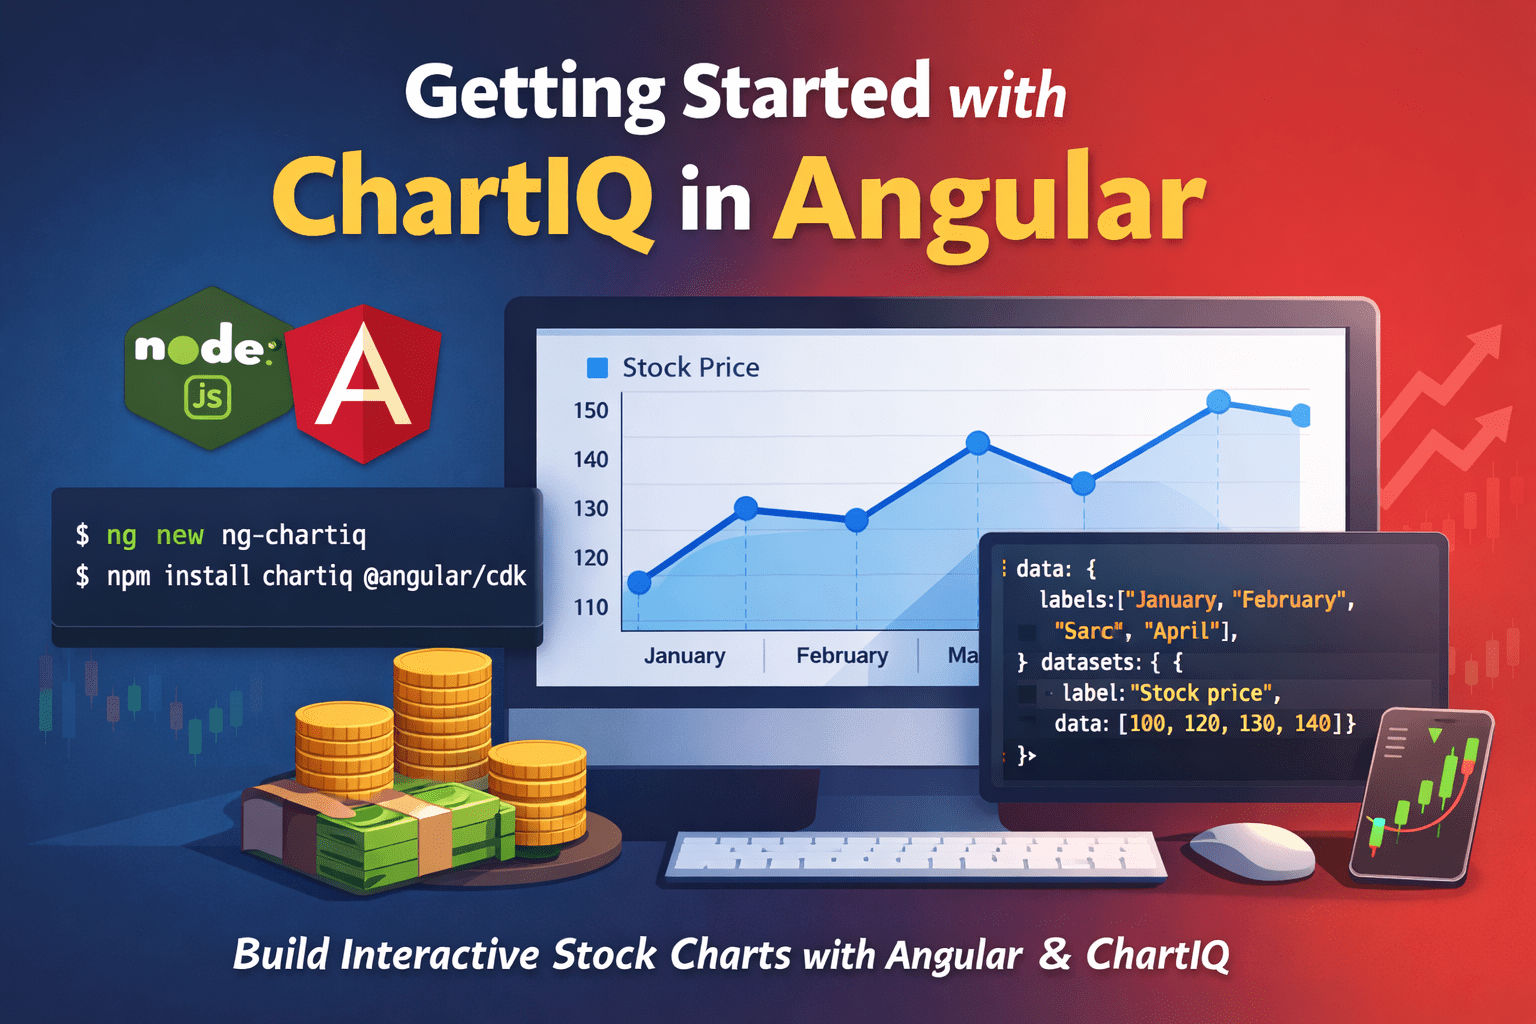
ng new ng-chartiq
This will create a new Angular project with the name ng-chartiq.
Step 2: Install ChartIQ and its dependencies
To use ChartIQ in your Angular application, you will need to install the ChartIQ library and its dependencies. Run the following command to install these packages:
npm install chartiq @angular/cdk @angular/animations
Step 3: Import ChartIQ and its dependencies in your Angular module
Next, you need to import the ChartIQ library and its dependencies in your Angular module. Open the file src/app/app.module.ts and add the following lines at the top:
import { BrowserModule } from '@angular/platform-browser';
import { NgModule } from '@angular/core';
import { CdkTableModule } from '@angular/cdk/table';
import { CdkTreeModule } from '@angular/cdk/tree';
import { MatTableModule } from '@angular/material/table';
import { MatTreeModule } from '@angular/material/tree';
import { BrowserAnimationsModule } from '@angular/platform-browser/animations';
import { ChartModule } from 'chartiq/js/chart';
Then, add the imported modules to the imports array of the NgModule decorator like this:
@NgModule({
  declarations: [
    AppComponent
  ],
  imports: [
    BrowserModule,
    CdkTableModule,
    CdkTreeModule,
    MatTableModule,
    MatTreeModule,
    BrowserAnimationsModule,
    ChartModule
  ],
  providers: [],
  bootstrap: [AppComponent]
})
export class AppModule { }
Step 4: Create a component for your chart
Now that you have ChartIQ set up in your Angular project, you can create a component to display your chart. Run the following command to generate a new component:
ng generate component chart
This will create a new component with the name chart in the src/app/chart directory.
Step 5: Display your chart in the component
To display your chart in the component, you will need to do the following:
In the src/app/chart directory, open the file chart.component.html and add an element with an ID attribute that will be used to reference the chart in your code. For example:
<div id="chartContainer"></div>
In the src/app/chart directory, open the file chart.component.ts and import the ChartIQ library at the top of the file:
import { Chart } from 'chartiq/js/chart';
In the ngOnInit lifecycle hook of the component, create a new instance of the Chart class and pass it the ID of the element where you want to display the chart. You can also specify the chart type, data, and other options in this step:
ngOnInit() {
  const chart = new Chart('chartContainer', {
    type: 'line',
    data: {
      // your data here
    },
    options: {
      // your options here
    }
  });
}
You can then use the chart instance to manipulate the chart, such as adding or updating data, changing the appearance, or responding to events.
I hope this helps you get started with ChartIQ in Angular! Please let me know if you have any questions or if you would like more information.
Step 6: Add data to the chart
To add data to the chart in the Angular component, you will need to specify the data in the data option of the Chart class when you create the chart instance. The data option should be an object with two properties: labels and datasets.
The labels property is an array of strings that represent the labels for each data point. For example, if you are charting stock prices over time, the labels could be the dates.
The datasets property is an array of objects that represent the data sets for the chart. Each object should have a label property that describes the data set, as well as a data property that is an array of numbers representing the data points.
Here is an example of how you could add data to the chart in the ngOnInit lifecycle hook of the component:
ngOnInit() {
  const chart = new Chart('chartContainer', {
    type: 'line',
    data: {
      labels: ['January', 'February', 'March', 'April'],
      datasets: [
        {
          label: 'Stock price',
          data: [100, 120, 130, 140]
        }
      ]
    },
    options: {
      // your options here
    }
  });
}
This would create a line chart with four data points, representing the stock price in January, February, March, and April. The data points would be plotted on the chart along the X-axis (time) and the Y-axis (price).
I hope this helps somebody!, drop a comment if any questions.
Conclusion:
- We have created a sample angular project using ChartIQ.
- We have added sample data to the chart.
