Dygraphs is a powerful and flexible open-source charting library that allows you to create interactive and customizable graphs and charts in your Angular applications. In this tutorial, we’ll walk through the steps for integrating dygraphs into an Angular project and creating your first chart.
Prerequisites
Before getting started, make sure you have the following dependencies installed:
- Angular CLI: This is used to create and manage Angular projects. If you don’t already have it installed, you can install it by running npm install -g @angular/cli.
- Dygraphs library: To install the Dygraphs library, run npm install dygraphs –save. Also, install the types, npm install @types/dygraphs –save-dev.
Step 1: Create a new Angular project
To create a new Angular project, open a terminal window and run the following command:
ng new ng-dygraphs
Replace ng-dygraphs with the name of your project. This will create a new Angular project with the specified name and install all the necessary dependencies.
Step 2: Add the dygraphs library to your project
To use dygraphs in your Angular project, you’ll need to first install the dependencies.
npm install dygraphs --save
Next, add @types for dygraphs.
npm install @types/dygraphs --save-dev
Step 3: Create a component for your chart
To create a chart with dygraphs, you’ll need to create a component for it. Run the following command to generate a new component:
ng generate component dygraphs-chart
Replace dygraphs-chart with the name of your component. This will create a new component in the src/app/dygraphs-chart directory with the specified name.
Step 4: Add the dygraphs code to your component
Now that you have a component set up, you can add the code to create a chart using dygraphs. Open the src/app/dygraphs-chart/dygraphs-chart.component.ts file and add the following code:
import { Component, ElementRef, OnInit, ViewChild, AfterViewInit } from '@angular/core';
import * as Dygraph from 'dygraphs';
@Component({
selector: 'app-dygraphs-chart',
templateUrl: './dygraphs-chart.component.html',
styleUrls: ['./dygraphs-chart.component.scss'],
})
export class DygraphsChartComponent implements OnInit, AfterViewInit {
@ViewChild('dygraphsChart') dygraphsChart!: ElementRef;
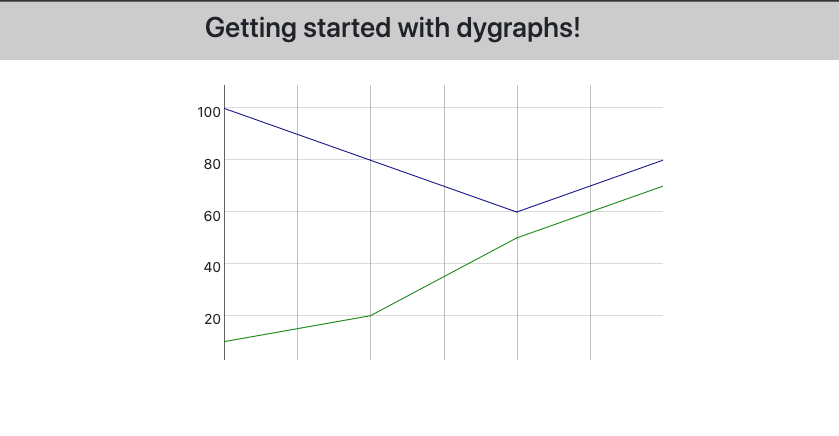
data = [
[1, 10, 100],
[2, 20, 80],
[3, 50, 60],
[4, 70, 80],
];
options = {
width: 500,
height: 300,
labels: ['X', 'Y1', 'Y2'],
};
constructor() {}
ngOnInit(): void {}
ngAfterViewInit() {
new Dygraph.default(
this.dygraphsChart.nativeElement,
this.data,
this.options
);
}
}
Lets also add code to our template file, Open the src/app/dygraphs-chart/dygraphs-chart.component.html file and add the following code:
<div class="dygraphs-chart" #dygraphsChart></div>
Run the application ng serve or npm start, you should see a line chart!!.
I hope this helps somebody!, drop a comment if any questions.
Conclusion:
- We have created a sample angular project using dygraphs.
- We have added a simple line chart with sample data to the component.
Checkout Github repo for complete code sample!.
