
Checkout the previous post to get started with d3.js in Angular application.
In this post we will talk about creating a heat map chart using the capabilities of d3.js.
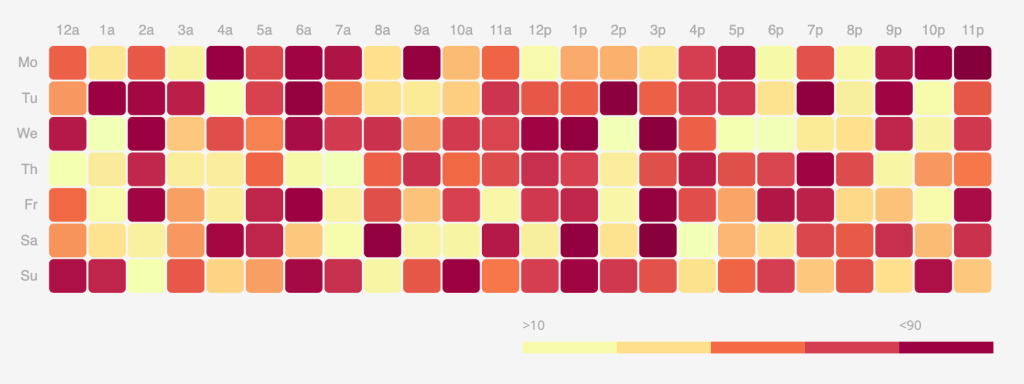
Just like any chart or graph, heat map is also a charting technique to visualize data in two dimensions w.r.t magnitude of an occurrence of an event represented with a color schema, typically the color schema varies from low to high depending on the magnitude.
Heat map
Create a new component.
import { Component, ElementRef, Input, OnInit, ViewChild } from '@angular/core';
import * as d3 from 'd3v6';
import * as _ from 'lodash';
import {
    HeatMap_ColorRange,
    HeatMap_DomainRange,
    HeatMap_Groups,
    HeatMap_Variables,
} from '../commom/constants';
import { HeatMapDataItemInterface } from '../commom/interfaces/heat-map-data-item.interface';
import { ChartsDataService } from '../commom/services/charts-data.service';

@Component({
    selector: 'app-heat-map',
    templateUrl: './heat-map.component.html',
    styleUrls: ['./heat-map.component.scss'],
})
export class HeatMapComponent implements OnInit {
    @ViewChild('chartContainer', { static: true }) chartContainer: ElementRef;
    @Input() chartId: string = 'heatmap';
    @Input() width: number = 600;
    @Input() height: number = 450;
    _chartData: HeatMapDataItemInterface[];

    private margin = { top: 40, right: 20, bottom: 20, left: 40 };
    private _chart = {
        svg: null,
        mainContainer: null,
        data: [],
        daysCount: 30,
        datesStrAsPerRange: '',
    };

    element!: HTMLElement;

    constructor(private service: ChartsDataService) {
        this._chart.data = service.getHeatMapData();
    }

    ngOnInit(): void {
        this.createHeatmap();
    }

    createHeatmap() {
        // set the dimensions and margins of the graph
        this.width =
            this.chartContainer.nativeElement.getBoundingClientRect().width;
        const widgetWidth =
            (this.chartContainer.nativeElement.getBoundingClientRect().width *
                60) /
            100;
        let heatMapHeight = Math.round(widgetWidth / 3.167);
        this.width = widgetWidth - this.margin.left - this.margin.right;
        this.height = heatMapHeight - this.margin.top - this.margin.bottom;
        const legendWidth = 80;

        /**
         * Remove all the elements in d3 charts if already exist
         */
        d3.select('#' + this.chartId)
            .selectAll('*')
            .remove();
        d3.select('#' + this.chartId + '_legend')
            .selectAll('*')
            .remove();

        /**
         * Mouse over function handler for the treemap nodes
         * Here we highlight the circle with the box shadow css
         */
        const mouseover = function () {
            d3.select(this).style('stroke', 'black');
        };

        /**
         * Mouse out handler
         */
        const mouseout = function () {
            d3.select(this).style('stroke', 'none');
        };

        // append the svg object to the body of the page
        const svg = d3
            .select('#' + this.chartId)
            .append('svg')
            .attr('width', this.width + this.margin.left + this.margin.right)
            .attr('height', this.height + this.margin.top + this.margin.bottom)
            .append('g')
            .attr(
                'transform',
                'translate(' + this.margin.left + ',' + this.margin.top + ')'
            );

        let groupNames = Object.values(HeatMap_Groups);
        let variableNames = Object.values(HeatMap_Variables);

        // Build X scales and axis:
        const x = d3
            .scaleBand()
            .range([0, this.width])
            .domain(groupNames)
            .padding(0.05);
        svg.append('g')
            .style('font-size', 12)
            .style('color', '#ADADAD')
            .attr('transform', 'translate(0, -5)')
            .call(d3.axisTop(x).tickSize(0))
            .select('.domain')
            .remove();

        // Build Y scales and axis:
        const y = d3
            .scaleBand()
            .range([this.height, 0])
            .domain(variableNames)
            .padding(0.05);
        svg.append('g')
            .style('font-size', 12)
            .style('color', '#ADADAD')
            .attr('transform', 'translate(-5, 0)')
            .call(d3.axisLeft(y).tickSize(0))
            .select('.domain')
            .remove();

        const myColor = d3
            .scaleLinear<string>()
            .range(HeatMap_ColorRange)
            .domain(HeatMap_DomainRange);

        // add the squares
        const cards = svg
            .selectAll()
            .data(this._chart.data, function (d) {
                return d.group + ':' + d.variable;
            })
            .enter()
            .append('rect')
            .attr('x', function (d) {
                return x(d.group);
            })
            .attr('y', function (d) {
                return y(d.variable);
            })
            .attr('rx', 4)
            .attr('ry', 4)
            .attr('value', function (d) {
                return d.value;
            })
            .attr('width', x.bandwidth())
            .attr('height', y.bandwidth())
            .attr('fill', 'white')
            .style('fill', function (d) {
                if (d.value === null || isNaN(d.value)) {
                    return '#C3C3C3';
                }
                return myColor(d.value);
            })
            .style('stroke-width', 2)
            .style('stroke', 'none')
            .style('opacity', 1)
            .on('mouseover', mouseover)
            .on('mouseout', mouseout)
            .on('mouseleave', mouseout);

        // append the legend svg object to the body of the page
        const legend = d3
            .select('#' + this.chartId + '_legend')
            .append('svg')
            .attr(
                'transform',
                'translate(' +
                    +(
                        this.width -
                        HeatMap_ColorRange.length * legendWidth +
                        this.margin.left
                    ) +
                    ',0)'
            )
            .attr('width', legendWidth * HeatMap_ColorRange.length)
            .attr('height', 35);

        const domainRange: string[] = HeatMap_DomainRange.map(
            (item, index, items) => {
                const domain = '' + item;
                if (index === 0) {
                    return '>' + domain;
                } else if (index === items.length - 1) {
                    return '<' + domain;
                }
                return '';
            }
        );
        legend
            .selectAll()
            .data(domainRange, function (d) {
                return d;
            })
            .enter()
            .append('g')
            .attr('class', 'g-legend')
            .append('rect')
            .attr('x', function (d, i) {
                return legendWidth * i;
            })
            .attr('y', 20)
            .attr('rx', 0)
            .attr('ry', 0)
            .attr('width', legendWidth)
            .style('width', '' + legendWidth + 'px')
            .attr('height', 10)
            .style('height', '10px')
            .style('fill', function (d, i) {
                return '' + HeatMap_ColorRange[i];
            });

        legend
            .selectAll('.g-legend')
            .append('text')
            .attr('class', 'g-legend-text')
            .text(function (d) {
                return '' + d;
            })
            .attr('x', function (d, i) {
                if (i === 0) {
                    return 0;
                }
                return legendWidth * i;
            })
            .attr('y', 10)
            .style('font-size', 11)
            .style('fill', '#ADADAD');

        legend.exit().remove();
    }
}
Code is pretty much self explanatory, there are two scales and axis (x, y) and the data is represented with groups, variables and domain range (color schema).
Check out the complete Angular project code on GitHub repo.
Hope you like the post!.
In the next post I will be trying transitions (animations), responsiveness and tooltips for the bar chart, so be sure to check it out.
