d3.js is one of the popular library to draw charts as per your requirements or needs. The library gives the developer with many options or freedom to draw the charts. Their gallery has many incredible examples and the community around this library is also quite impressive.
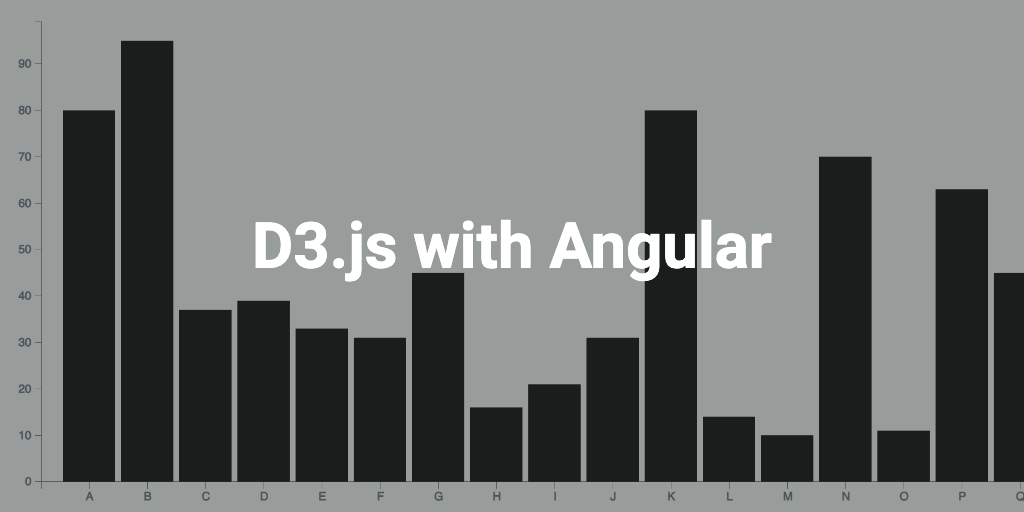
Its super easy to get started. First off you need some basic knowledge about SVG and CSS. There are many posts or articles out there for you to explore. But in this post I will be talking about using d3.js to develop a simple bar chart in Angular application.
Dependencies
- A sample angular project to get started or use @angular/cli to create one, again many posts available online to do this.
- Install D3 packages.
- $npm i d3
- $npm i -D @types/d3
Bar chart
Create a new bar chart component $ng g c BarChart. A bar chart typically has two axis (X, Y) and the bars.
import {
    Component,
    OnInit,
    Input,
    ChangeDetectionStrategy,
    ChangeDetectorRef,
    ViewChild,
    ElementRef,
} from '@angular/core';
import * as d3 from 'd3v6';
import cloneDeep from 'lodash/cloneDeep';
import { DataItemInterface } from '../commom/interfaces/data-item.interface';
import { ChartsDataService } from '../commom/services/charts-data.service';

@Component({
    selector: 'app-bar-chart',
    templateUrl: './bar-chart.component.html',
    styleUrls: ['./bar-chart.component.scss'],
    changeDetection: ChangeDetectionStrategy.OnPush,
})
export class BarChartComponent implements OnInit {
    @ViewChild('chartContainer', { static: true }) chartContainer: ElementRef;
    @Input() chartId: string = 'bar';
    @Input() width: number = 600;
    @Input() height: number = 450;
    _chartData: DataItemInterface[];

    private margin = { top: 20, right: 20, bottom: 35, left: 40 };
    private _chart = {
        svg: null,
        xAxis: null,
        yAxis: null,
        xScale: null,
        yScale: null,
        x: null,
        y: null,
        mainContainer: null,
        bars: null,
    };

    get barWidth(): number {
        {
            return this.width - this.margin.left - this.margin.right;
        }
    }

    get barHeight(): number {
        {
            return this.height - this.margin.top - this.margin.bottom;
        }
    }

    constructor(
        private _cd: ChangeDetectorRef,
        private dataService: ChartsDataService
    ) {
        this._chartData = dataService.getData(22);
        this._cd.markForCheck();
    }

    ngOnInit(): void {
        this.initChart();
        this.draw();
        this._cd.markForCheck();
    }

    @Input()
    set chartData(items: DataItemInterface[]) {
        if (items) {
            this._chartData = cloneDeep(items);
            this.draw();
        }
    }

    get chartData(): DataItemInterface[] {
        return this._chartData;
    }

    private initChart() {
        this._chart.svg = d3.select('#bar').select('svg');
        this._chart.xScale = d3.scaleBand();
        this._chart.yScale = d3.scaleLinear();
        this.setSVGDimensions();
        this._chart.mainContainer = this._chart.svg
            .append('g')
            .attr(
                'transform',
                `translate(${this.margin.left}, ${this.margin.top})`
            );
        this._chart.y = this._chart.mainContainer
            .append('g')
            .attr('class', 'axis axis--y');
        this._chart.x = this._chart.mainContainer
            .append('g')
            .attr('class', 'axis axis--x');
    }

    private setSVGDimensions() {
        const rect = this.chartContainer.nativeElement.getBoundingClientRect();
        this.width = rect.width;
        this._chart.svg.style('width', this.width).style('height', this.height);
    }

    private draw() {
        this.setAxisScales();
        this.drawAxis();
        this.drawBars();
    }

    private setAxisScales() {
        this._chart.xScale = d3.scaleBand();
        this._chart.yScale = d3.scaleLinear();

        this._chart.xScale
            .rangeRound([0, this.barWidth])
            .padding(0.1)
            .domain(this.chartData.map((d) => d.name));
        this._chart.yScale
            .range([this.barHeight, 0])
            .domain([0, Math.max(...this.chartData.map((x) => x.value))]);
        this._chart.xAxis = d3.axisBottom(this._chart.xScale);
        this._chart.yAxis = d3.axisLeft(this._chart.yScale);
    }

    private drawAxis() {
        this._chart.y
            .attr('transform', `translate(0, 0)`)
            .call(this._chart.yAxis);
        this._chart.x
            .attr('transform', `translate(0, ${this._chart.yScale(0)})`)
            .call(this._chart.xAxis);
    }

    private drawBars() {
        const calcBarY = (yPos) => {
            return !yPos ? this._chart.yScale(0) - 1 : this._chart.yScale(yPos);
        };
        const calcBarHeight = (yPos) =>
            Math.max(0, this._chart.yScale(0) - calcBarY(yPos));

        this._chart.bars = this._chart.mainContainer
            .selectAll('.bar')
            .remove()
            .exit()
            .data(this.chartData)
            .enter()
            .append('rect')
            .attr('class', 'chart-bar');

        this._chart.bars
            .attr('x', (d) => this._chart.xScale(d.name))
            .attr('y', (d) => this._chart.yScale(d.value))
            .attr('width', this._chart.xScale.bandwidth())
            .attr('height', (d) => calcBarHeight(d.value));
    }
}
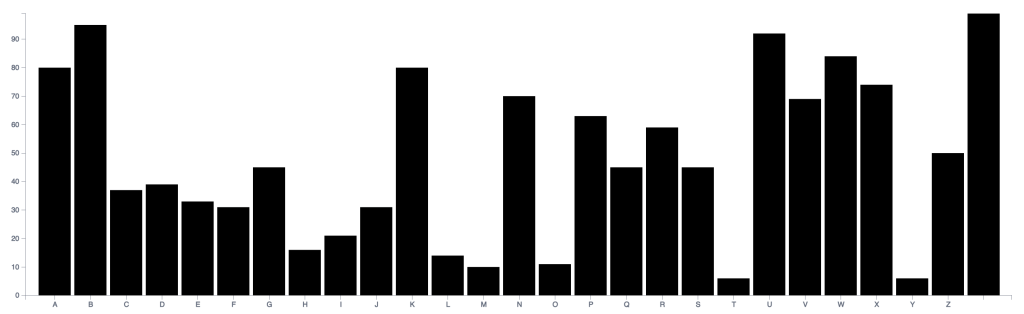
The above code is basically self-explanatory, try changing things and explore, and see below the chart we get.
Let’s look at our bar chart template code.
<div class="bar-chart" #chartContainer>
    <div class="bar-chart__main" id="bar">
        <svg></svg>
    </div>
</div>
And finally some styling…
.bar-chart {
    display: flex;
    flex-direction: column;
    width: 100%;
    height: 100%;

    &__main {
        flex: 1;
        position: relative;

        ::ng-deep svg {
            $lineColor: #6f7583;
            outline: none;

            .axis {
                path,
                line {
                    fill: none;
                    stroke: $lineColor;
                    stroke-width: 0.5;
                    shape-rendering: crispEdges;
                }

                text {
                    fill: #c3c3c3;
                    stroke: #c3c3c3;
                    stroke-width: 0.5;
                }
            }

            .chart-bar {
                outline: none;
                stroke: transparent !important;
                fill-opacity: 1 !important;
            }
        }
    }
}
Check out the complete Angular project code on GitHub repo.
Conclusion
d3.js is a powerful library but there is also a steep learning curve and you could easily get lost when trying to debug or find some solution. Best recommend approach is to go over the docs first and understand how things work under the hood.
Hope you like the post!.
In the next post I will be trying transitions (animations), responsiveness and tooltips for the bar chart, so be sure to check it out.

2 thoughts on “Developing charts using d3.js in Angular.”